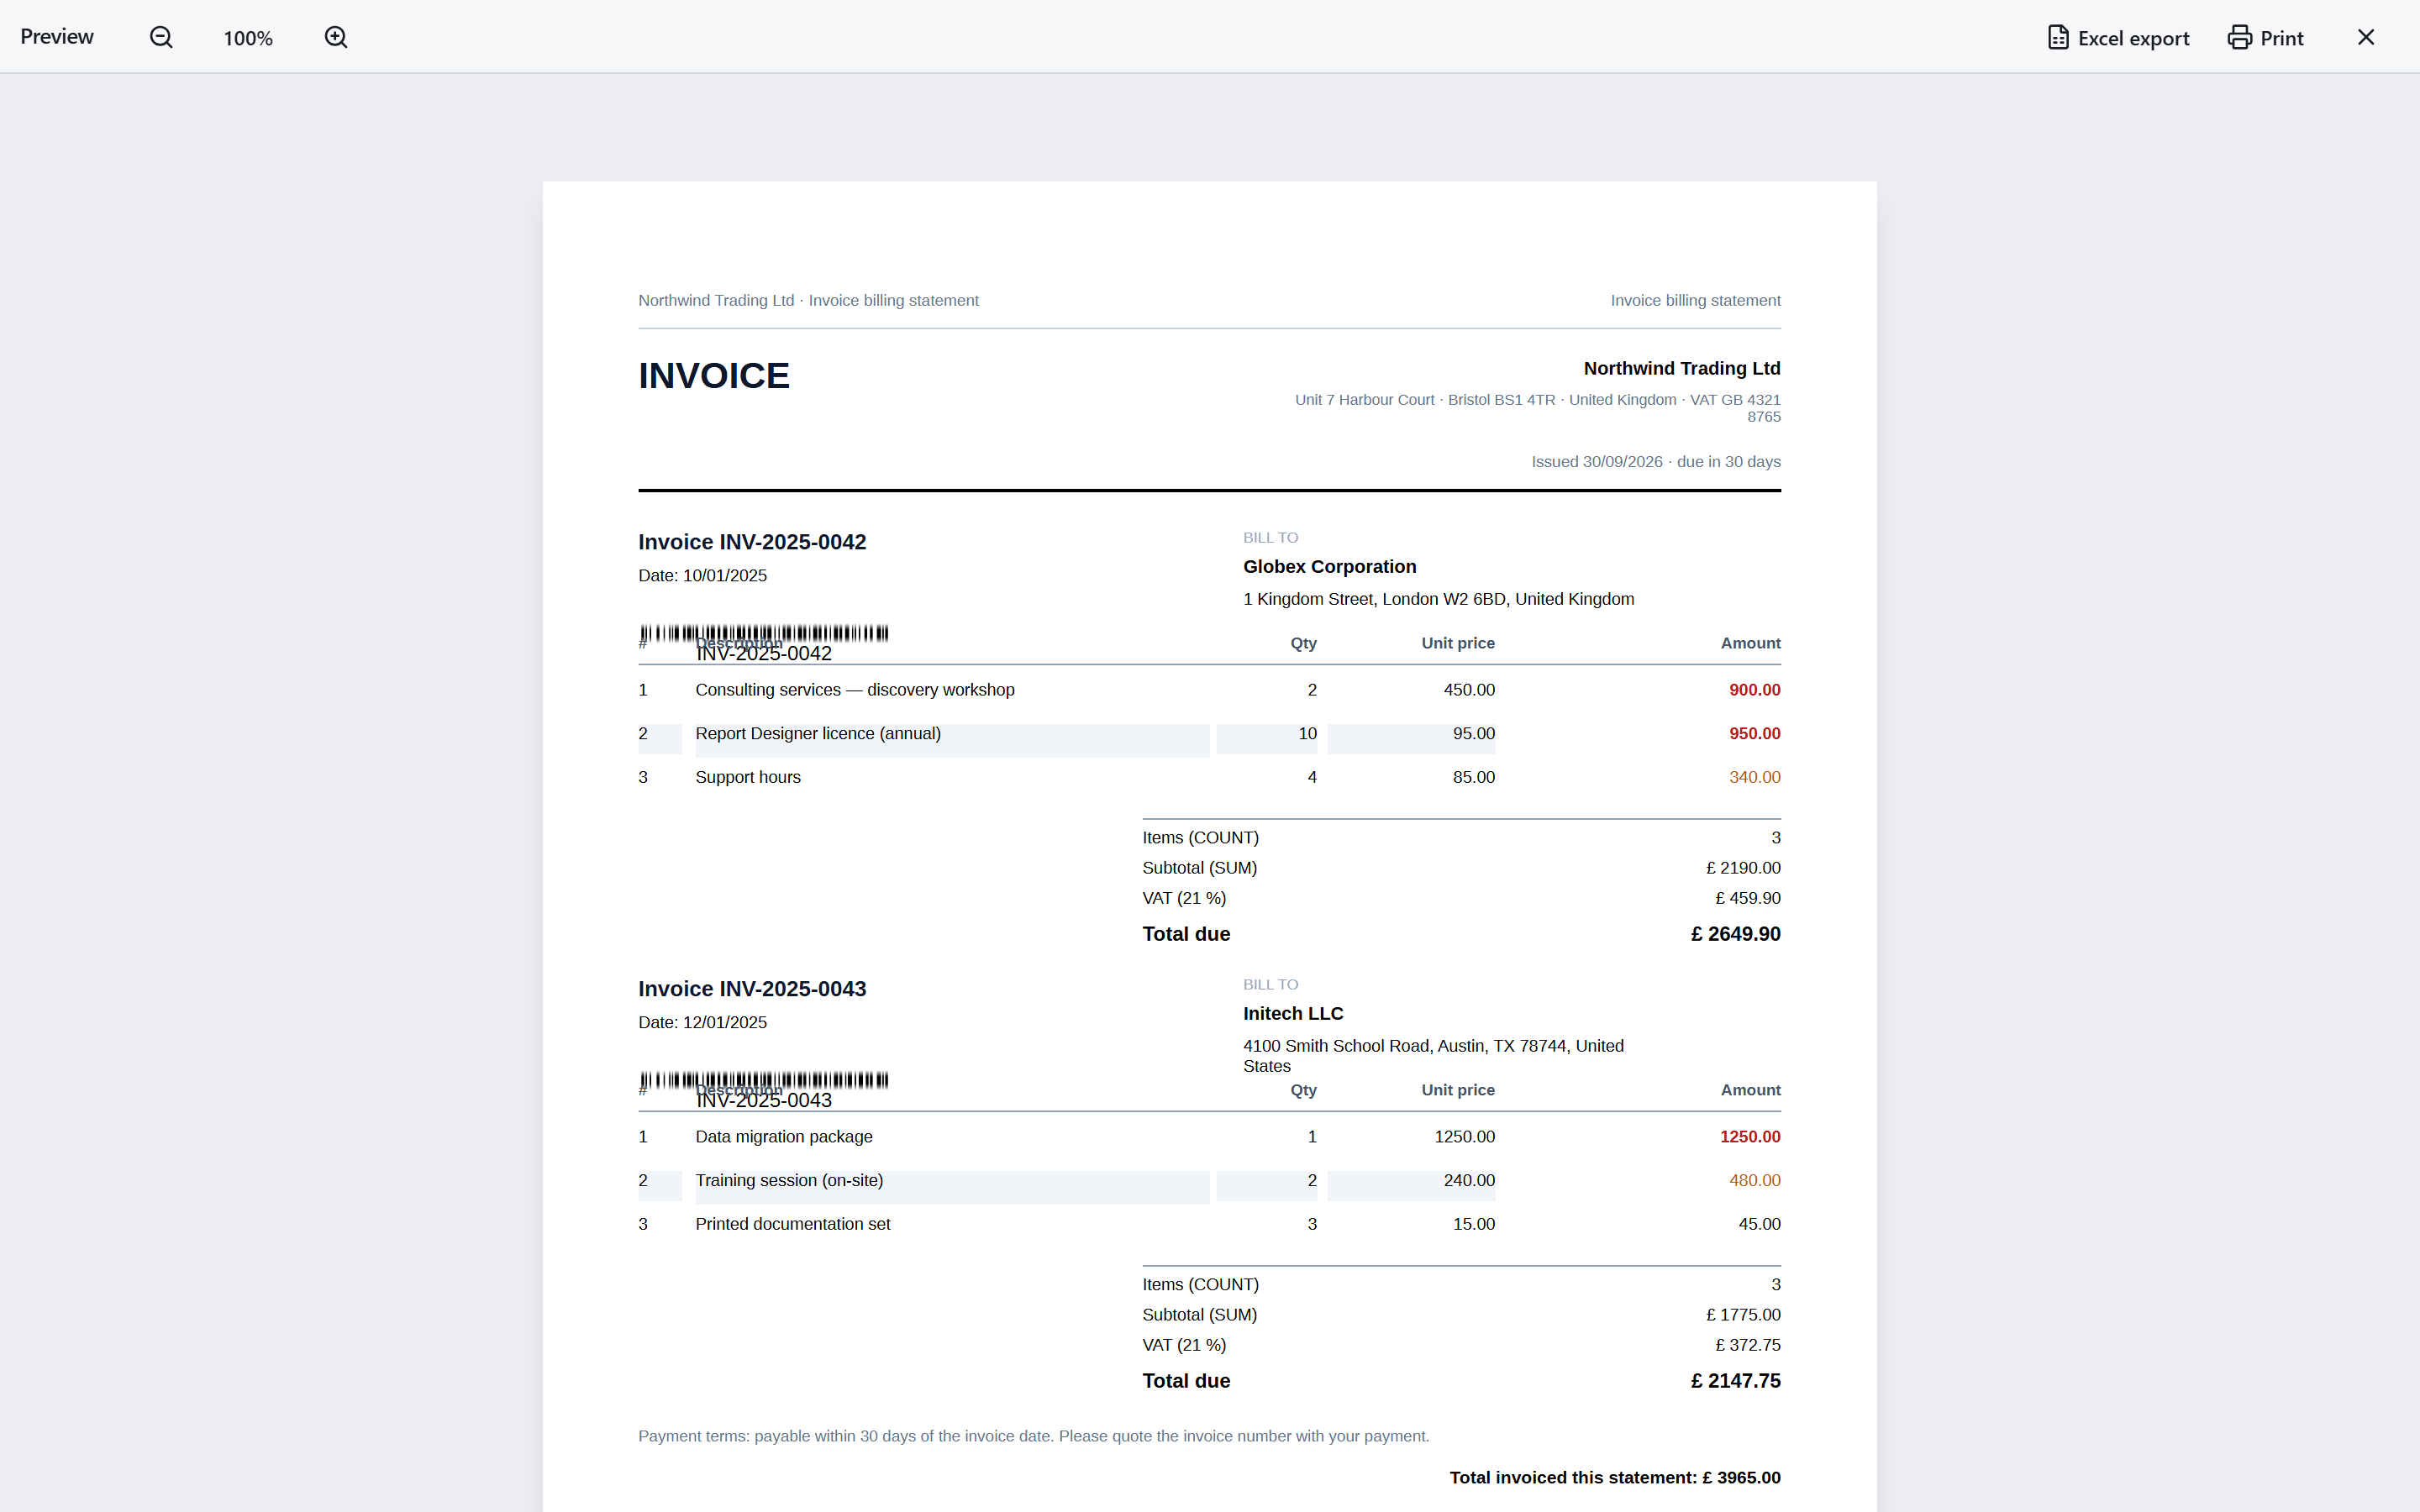
Reporting tools tend to cluster at two extremes. On one end: heavyweight server products with admins to call, drivers to install and invoices to match. On the other: lightweight form builders that look like report tools until you print — and discover that “page 2 of 37” was a guess and your group header splits across a page break.
DukReport lives in the gap. It is a full visual designer — bands, snap guides, multi-select, a layers panel, a screen-reader-accessible structure tree — packaged as an installable PWA that works with the network cable unplugged. Your data stays on your device. That is not a marketing flourish; it is the architecture.
Pagination is the product
Real reports are built from bands, not free-flowing pages. DukReport models them explicitly:
report-header   # once, top of the first page
page-header     # every page
group-header    # per group, levels 1..n
detail          # per row
group-footer    # closes its group pair
page-footer     # every page
report-footer   # once, bottom of the last page
Keep-together and page-break rules stop rows and groups from tearing across pages. Page
numbers are not an afterthought either: PAGENUM and PAGECOUNT
are resolved by a dual-pass layout — one pass to count the pages, a second to place them
— so “page 2 of 37” is a fact, not a prediction.
The preview is the PDF
Most web tools render reports with DOM and CSS, then cross their fingers and hand the
result to a separate PDF library. DukReport refuses the detour: the on-screen preview
and the print document come from the same draw pipeline, and exactly one engine ever
commits them to PDF — Chromium. Export from the optional desktop shell and a
headless Chromium writes the file; work in a plain browser and the print button hands
the same document to your browser’s “Save as PDF” — with
@page margin: 0 so no stray headers or footers sneak in.
A hand-written PDF writer in TypeScript shipped for a while. It was retired deliberately: keeping a second render path around “just for tests” quietly doubled the work on every feature. One engine, one truth.
Fonts are the self-hosted Liberation family — nothing is fetched from a CDN — chosen because they are metric-compatible with Arial, Times and Courier, so the standalone print document can fall back to those system stacks and still line up to the pixel.
Data without a backend
Reports pull from datasets you control — fetched by your browser, never routed through a third-party server:
- CSV — paste or load delimited files, fields detected automatically.
- JSON — arrays and nested objects mapped onto report fields.
- REST — a wizard with a live response preview, pointed at any endpoint.
- Manual — small typed-in tables for lookups and reference data.
Datasets link together through master–detail relations for invoices and order
lists. Typed parameters (string, number, date, boolean) are enforced at preview time.
Expressions get lazy if(), aggregates in groups, and named formulas
callable anywhere as @name. And when an expression is wrong, the error
appears inline beneath the input — never as a wall of popups.
An honest file format
A saved report is a .duk file: an ordinary ZIP containing a
schema-validated doc.json plus your assets. Unzip it, read it, script it.
The schema is versioned with a migration chain, so old files keep opening in new
releases. No lock-in clause hides in the file format.
Under the hood
- Svelte 5 runes and strict TypeScript — declarative UI, a single command funnel from components to state, and undo/redo built on whole-document snapshots.
- Zod on every boundary — files, REST responses and desktop-shell calls are validated before they touch the model.
- Autosave and multi-tab sync — every change lands in IndexedDB and travels to other open tabs over a BroadcastChannel. Closing the wrong tab is no longer a data loss event.
- Accessible and multilingual — WCAG AAA contrast, keyboard-first editing, and ships in English, Dutch and French.
Where it's heading
Charts are next, rendered through the same draw pipeline as everything else — so preview
and PDF stay identical by construction. After that: dynamic tables bound to dataset
fields, declarative dataset transforms, and template galleries. For embedding, DukReport
already ships routes for a desktop shell: a read-only
#/viewer and a #/designer-locked mode where the layout is
fixed but the data isn't, both documented through an OpenAPI contract.
Want to try it yourself? The web app runs at dukreport.tureluut.be, and for Windows there is a demo zip waiting on the download page — unzip and run, no installation. The product page collects screenshots, requirements and an FAQ in one place.
The through-line is simple: a report is a promise about how a page will look on paper. The tool that keeps that promise should not need a server to do it.